Patterns of Volatility in Networked Progressive Gaming Systems and Effects on Long-Term Returns for Players
Written by Clara Richter · Aug 25, 2026
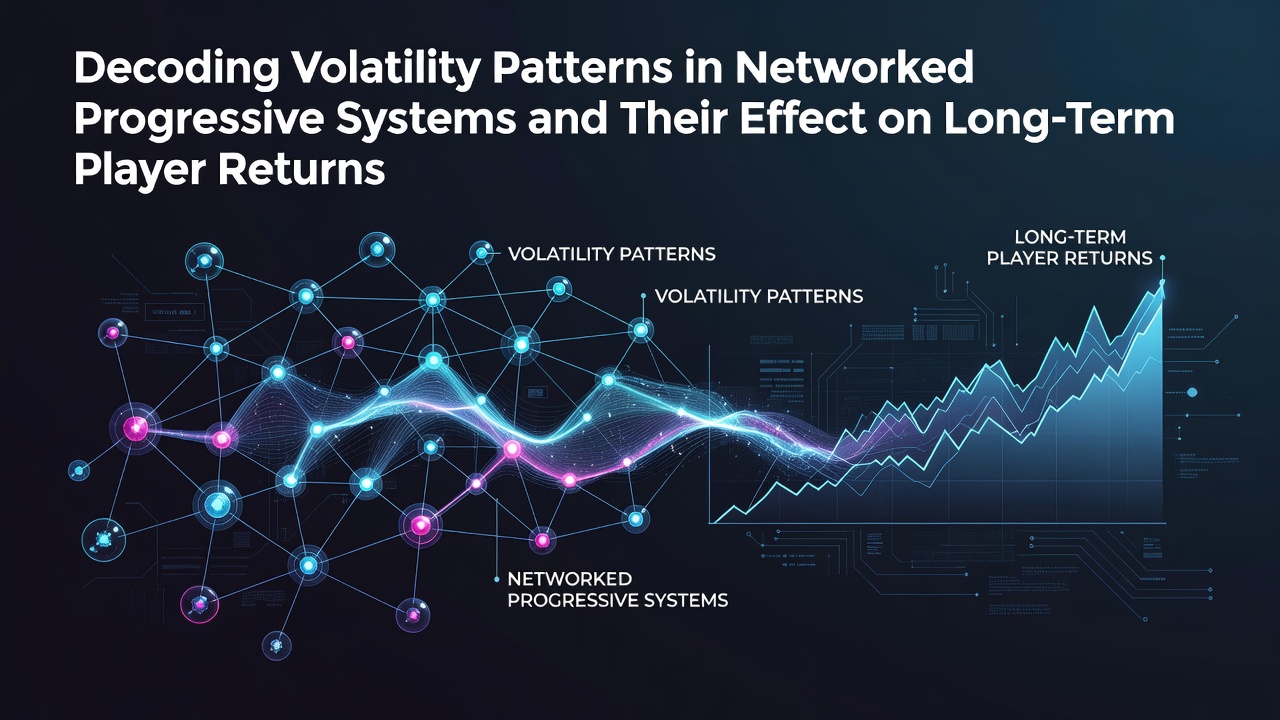
Patterns of Volatility in Networked Progressive Gaming Systems and Effects on Long-Term Returns for Players
Networked progressive systems connect multiple gaming machines across locations so that a portion of each wager feeds into a shared jackpot pool and this structure creates distinct volatility patterns compared with standalone machines. Researchers at institutions like the University of Nevada Reno have tracked how these linked pools generate larger but less frequent payouts while base game returns remain governed by fixed mathematical models. Data from August 2026 indicates that progressive contributions typically range between 1 and 3 percent of total wagers depending on jurisdiction and network scale.
Core Mechanics Driving Volatility
Each bet placed on a connected machine adds to the jackpot meter and the probability of triggering the progressive win follows a random number generator calibrated to specific hit frequencies. Observers note that higher contribution rates accelerate meter growth yet simultaneously widen the gap between average base game outcomes and the rare jackpot events. Studies from the Australian Gambling Research Centre show that networks spanning several hundred machines exhibit variance coefficients up to 40 percent higher than isolated terminals because the shared pool introduces an additional layer of outcome distribution.
Long-term player returns stay anchored to the theoretical return-to-player percentage published for each title and this figure already accounts for the progressive seed and contribution mechanics. Regulators in Nevada require operators to publish updated RTP ranges whenever network configurations change and similar disclosure rules apply under the Malta Gaming Authority for European-facing platforms.
Observed Patterns Across Network Scales
Smaller regional networks tend to produce more frequent but modestly sized progressive wins while continent-wide systems accumulate jackpots that reach seven or eight figures before hitting. Figures released by the Canadian Gaming Association in mid-2026 reveal that networks exceeding 1,000 linked terminals recorded an average jackpot cycle length of 14 weeks whereas networks under 200 terminals averaged 5 weeks. These cycles directly influence the distribution of returns over extended play periods because players encounter extended sequences of non-progressive outcomes punctuated by occasional large awards.
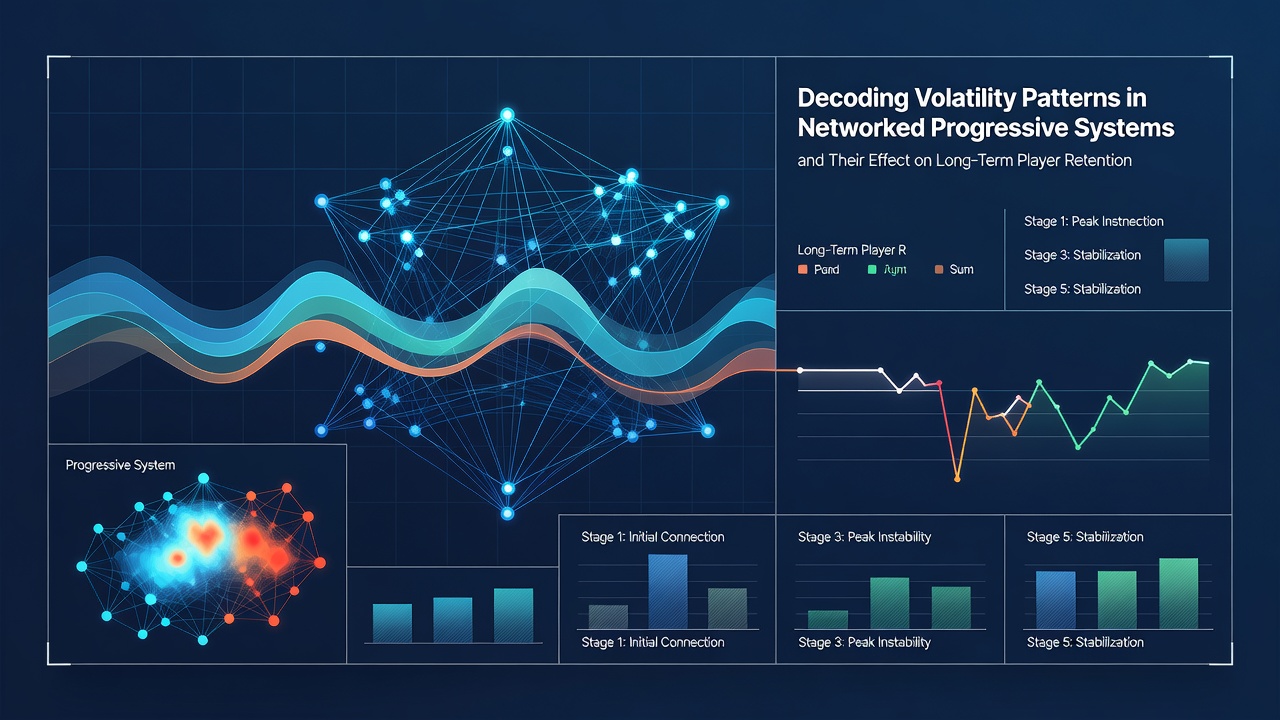
Impact on Sustained Return Metrics
Statistical models developed by gaming mathematicians demonstrate that volatility in progressive networks does not alter the overall house edge yet it changes the shape of return curves over thousands of spins. Players who remain in the system for extended sessions experience return clustering around the mean RTP while shorter sessions show greater deviation from that mean. Research published by the University of Macau Gaming Research Institute confirms that session-length distributions correlate with observed bankroll volatility and networks with slower meter growth produce steadier incremental returns between jackpot triggers.
Regulatory data collected across multiple jurisdictions further indicates that progressive contributions are fully integrated into the certified RTP calculation so the long-term expectation remains consistent regardless of network size. Operators must submit independent audit reports at regular intervals and these reports detail both base game and progressive components separately.
Measurement Approaches Used by Analysts
Analysts employ standard deviation calculations and hit-frequency simulations to quantify volatility within specific networks. These methods allow comparison between different progressive structures without relying on anecdotal reports. Reports from the New Jersey Division of Gaming Enforcement provide quarterly summaries that include variance metrics for every certified progressive title operating within the state and similar transparency requirements exist in other regulated markets.
Simulation software replicates millions of game cycles to map the probability density of returns at various time horizons and these outputs help illustrate why networks with identical RTP percentages can display markedly different short-term behavior. The underlying random number generators remain independent of network size so any perceived pattern stems from the size and frequency of the progressive award rather than changes in base probability.
Conclusion
Networked progressive systems introduce measurable volatility layers that reshape return distributions while preserving the certified long-term RTP for each game. Data collected through 2026 across multiple regulatory environments confirms that jackpot cycle length and network scale determine the timing of large awards yet do not modify the overall mathematical expectation. Continued monitoring by academic researchers and government agencies supplies the empirical foundation for understanding these dynamics in operational settings.