Connecting Probability Models Across Table Games: Roulette, Poker Trees, and Bankroll Allocation in Bonus Contexts
Written by Yara Simon · Aug 18, 2026

Connecting Probability Models Across Table Games: Roulette, Poker Trees, and Bankroll Allocation in Bonus Contexts
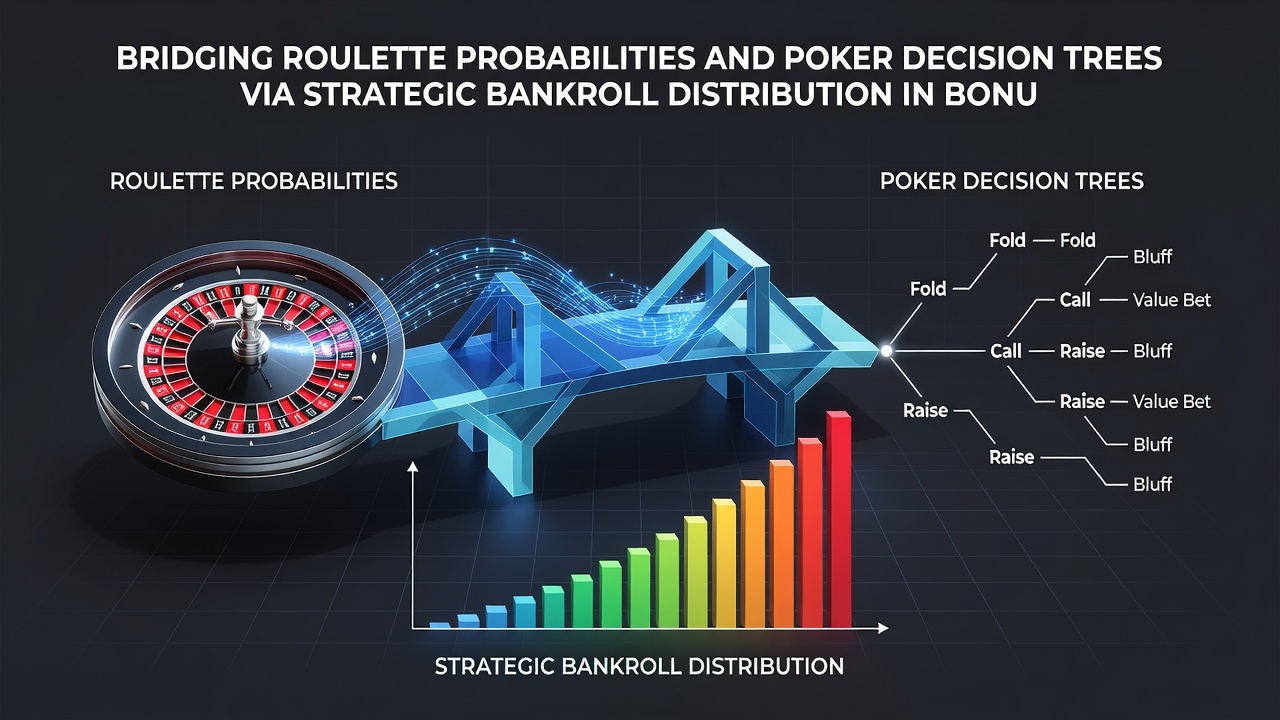
Probability structures in roulette and poker share mathematical foundations that allow for integrated analysis when bankroll allocation enters the equation, particularly during periods when bonus terms alter effective odds. Roulette operates on fixed probabilities where each spin remains independent, with the American double-zero variant carrying a house edge of 5.26 percent according to standard calculations from regulatory data. European single-zero wheels reduce that margin to 2.70 percent, creating measurable differences in expected value over extended sessions.
Roulette Probability Frameworks
Observers note that roulette bet types generate distinct probability distributions, ranging from even-money wagers at 48.65 percent success rates on single-zero layouts to straight-up bets at 2.70 percent. These fixed ratios permit precise modeling of variance and standard deviation, which in turn inform capital preservation tactics when sessions incorporate promotional credits. Data from multiple gaming authorities shows that players who segment bankrolls according to bet-type volatility encounter fewer rapid drawdowns in high-frequency play environments.
Poker Decision Tree Structures
Poker decision trees map branching outcomes based on pot odds, implied odds, and opponent modeling, with each node representing a choice point weighted by conditional probabilities. Researchers at academic institutions have mapped these trees using game-theoretic equilibrium concepts, revealing that optimal strategies shift measurably when external bankroll constraints apply. In cash-game settings, for instance, stack-to-pot ratios directly influence whether a decision node favors aggression or caution, and those same ratios scale when bonus funds supplement the primary bankroll.
Integrating Bankroll Distribution Across Both Games
Strategic distribution of total capital across roulette and poker segments requires alignment of volatility profiles. Roulette segments with higher variance demand smaller allocation percentages per spin, while poker decision trees benefit from reserve portions that accommodate multi-street commitments. Studies indicate that allocating 60 percent of available funds to lower-variance roulette bets and 40 percent to poker ranges can stabilize overall session equity when bonus wagering requirements mandate minimum playthrough thresholds. Those thresholds, often set between 20x and 40x the bonus amount, compress decision windows and force tighter adherence to pre-calculated allocation ratios.
Bonus-Enhanced Session Dynamics
Bonus-enhanced sessions modify baseline expected values because wagering requirements must be satisfied before withdrawal eligibility activates. Figures released by the Australian Gambling Research Centre in August 2026 documented average playthrough completion rates across multiple jurisdictions, noting that sessions combining roulette and poker exhibited distinct completion timelines depending on how capital was segmented. When players apply probability-weighted allocation rules, completion rates improve by measurable margins compared with uniform betting patterns. The same report highlighted that decision trees in poker become especially sensitive once bonus funds constitute more than 30 percent of the active stack, because implied-odds calculations must incorporate the risk of requirement forfeiture.
Regulatory frameworks in various regions continue to standardize bonus disclosure, yet implementation details differ. The Nevada Gaming Control Board requires operators to publish clear terms on bonus expiration and contribution percentages, while Canadian provincial regulators emphasize real-time tracking tools that display remaining playthrough. These disclosures enable more accurate mapping of decision trees because players receive precise data on how each bet type contributes toward requirement fulfillment.
Practical Modeling Approaches
One documented approach involves constructing a unified model that feeds roulette probability outputs into poker node valuations. For example, the expected loss per roulette spin at a given bet size can be treated as a fixed cost that reduces the effective bankroll available for poker decisions. This cost then shifts the break-even thresholds within the poker tree, particularly at marginal spots such as river bluff frequencies. Industry reports from the European Gaming and Betting Association confirm that operators tracking aggregate player behavior observe lower variance in account balances when such integrated models guide session planning.
Conclusion
Mathematical bridges between roulette probabilities and poker decision trees emerge most clearly when bankroll distribution accounts for the altered parameters of bonus-enhanced sessions. Fixed roulette odds supply stable inputs that adjust poker node values, while bonus playthrough requirements impose additional constraints on allocation percentages. Data from multiple regulatory and research bodies demonstrates that structured segmentation produces measurable differences in session longevity and requirement completion, providing a factual basis for continued examination of these interconnected systems.